Monfort Heights Has One Median Price and Three Different Housing Markets
September 24, 2026
September 24, 2026
Pull up Monfort Heights on a real estate portal twice in the same sitting and you can get two different numbers for the same slice of the neighborhood without touching a filter. As of August 2026, the rolling 12-month median for Monfort Heights South sat at $315,000, up 25% year over year. The same portal's quick-stat panel for that identical pocket showed $355,000. Different measurement windows, same address range, forty thousand dollars apart.
That gap isn't a data error. It's a symptom of a bigger problem with how this neighborhood gets reported: the number most buyers anchor to, the blended "Monfort Heights" median, is stitching together at least three markets that don't behave the same way, don't sell at the same pace, and in one case, don't even get tracked as a separate market at all.
The topline figure most buyers encounter is straightforward. Over the three months ending June 2026, Monfort Heights posted a median sale price of $301,000, up 20.3% from the same period the year before, with a median of $174 per square foot, up 12.6%. Homes moved in 37 days on average, down from 43 the previous year, and 68 homes sold in June 2026 compared to 52 in June 2025.
That number is real. It's also an average of parts that used to be counted separately, and in one case, still should be.
Monfort Heights wasn't always one place on paper. Before it consolidated into a single census-designated place, it existed as two distinct entities: Monfort Heights East and Monfort Heights South. Those seams still show up in how the housing stock and the pricing behave, and they line up almost exactly with Interstate 74, which runs east to west through the community and splits it, as one source put it, "in half horizontally."
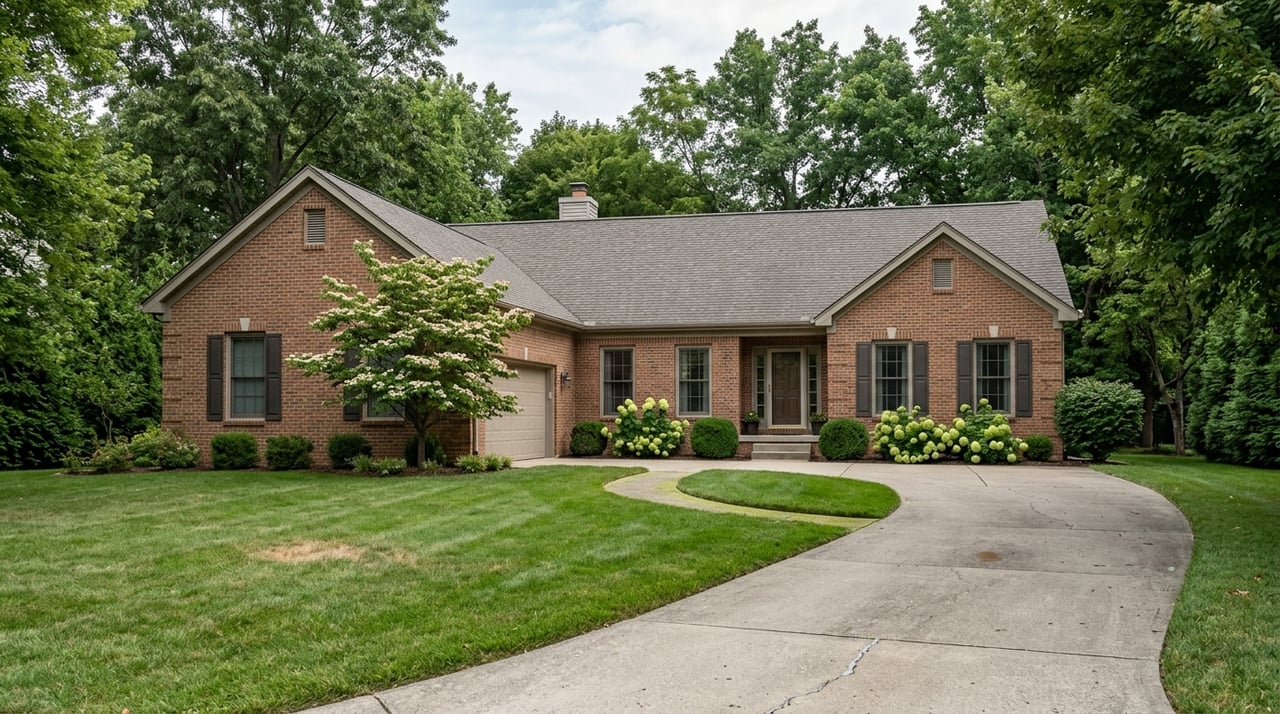
South of that line, and in the informally named western pocket, the neighborhood was farmland into the 1920s. What is now South Monfort Heights was originally called Wisenburg and didn't get its current name until 1926, after decades as a small farming community. When it did develop, it picked up pockets of 1920s Traditional architecture, 1930s-era Cape Cods, and Tudor-influenced homes built after World War II, along with ranch-style and split-level houses from the 1950s and 60s suburban boom, many sitting on lots over half an acre.
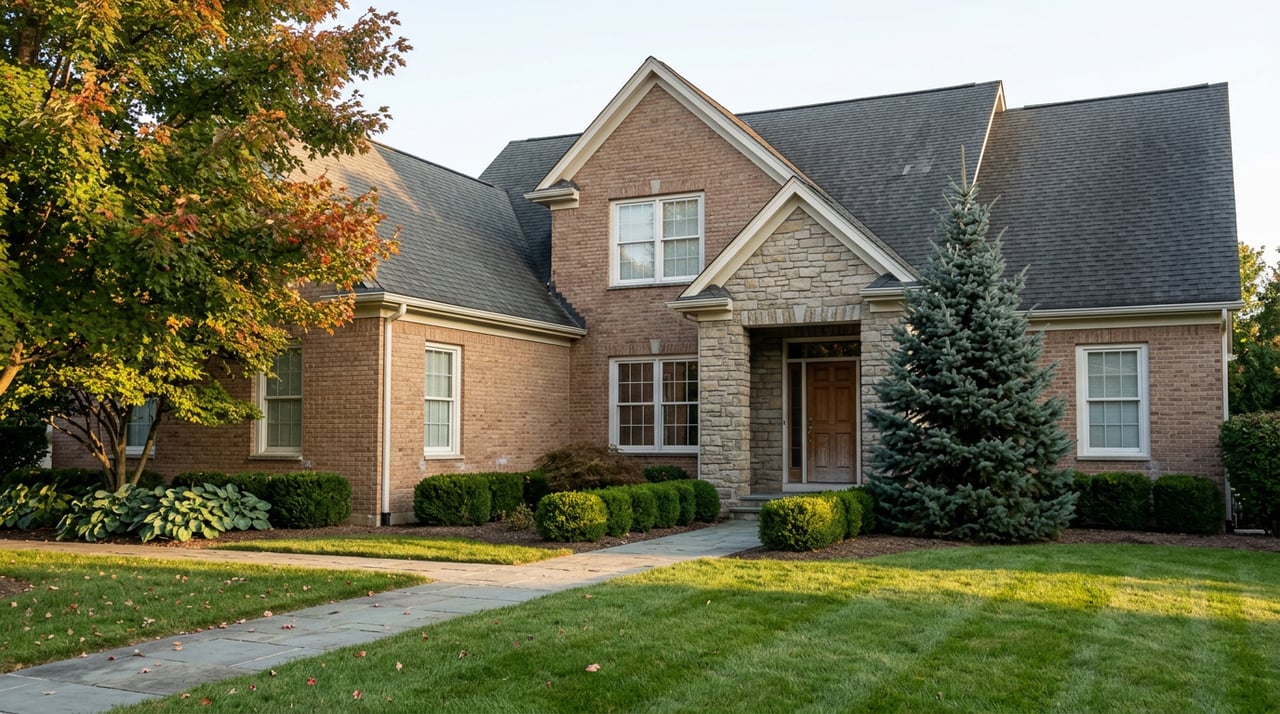
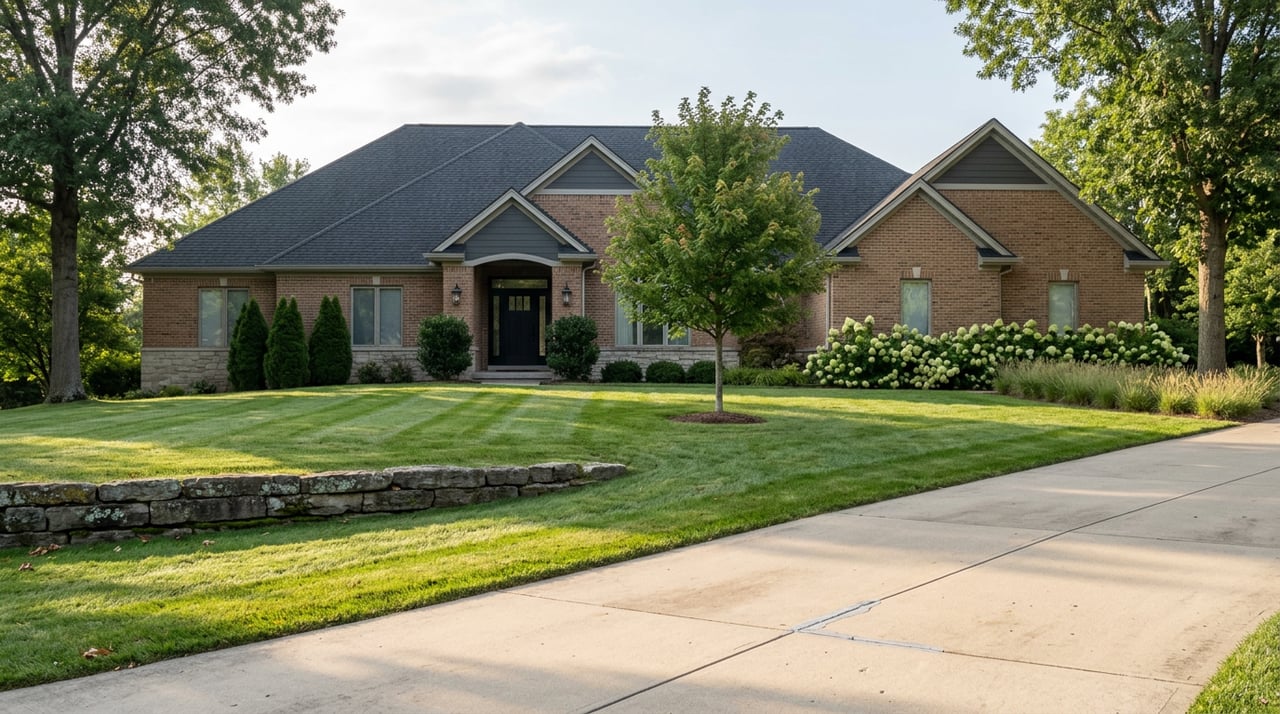
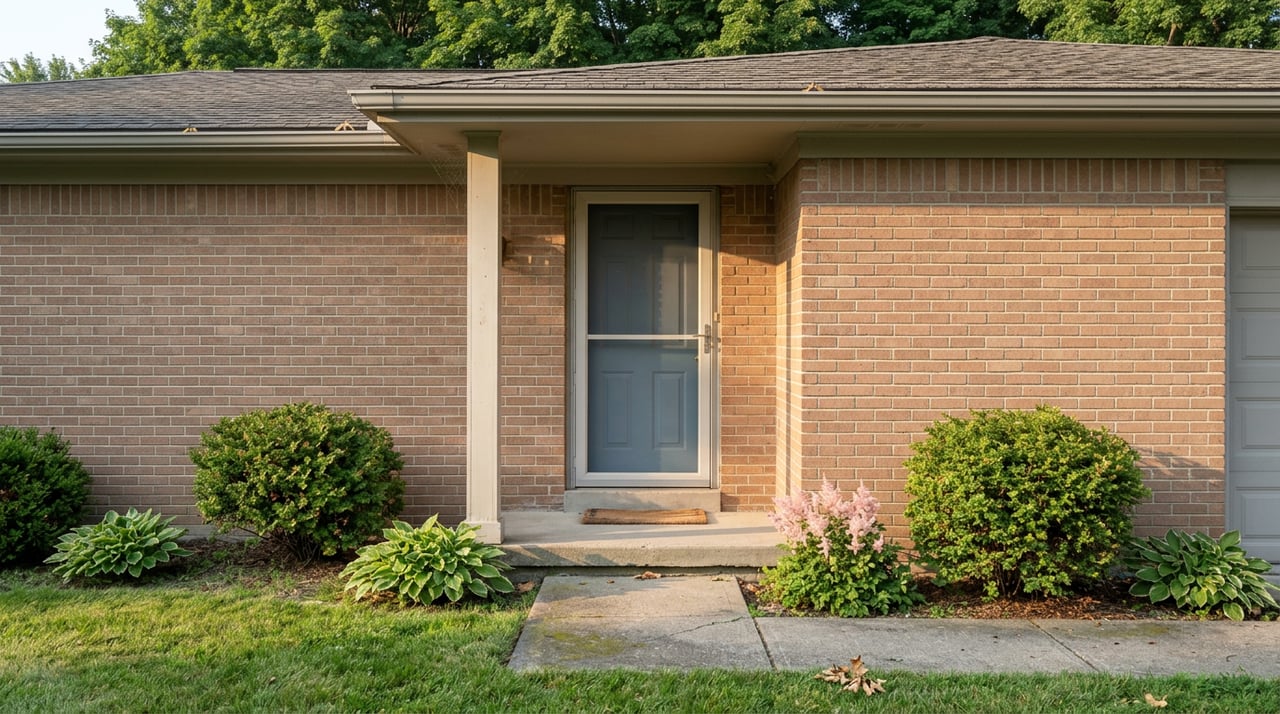
East of the interstate, development came later and looked different. The last few decades brought newer construction to Monfort Heights East specifically, with wide streets lined by "New Traditional" homes on more open lawns and noticeably thinner tree cover than the older pockets to the south and west.
That's the mechanism. The blended median isn't averaging similar houses in similar locations. It's averaging a 1930s Tudor on a wooded acre against a recently built home on an open, sun-exposed lot, and reporting the midpoint as if it describes either one.
Here's how the three pockets break down using the most recent figures available for each:
| Recent Median | Change | Days on Market | Housing Stock | |
|---|---|---|---|---|
| Monfort Heights East | $300,000 (3 mo. through June 2026) | +16.0% YoY | 32 days, down from 48 | Newer "New Traditional" construction on smaller, open lots |
| Monfort Heights South | $315,000 (12-mo. rolling, as of Aug. 2026) | +25% YoY | 31 days, vs. 56-day national average | 1920s-30s Traditional, Cape Cod, and Tudor homes on larger, wooded lots |
| West Monfort Heights | Not tracked as its own market | N/A | 21 days | 1950s-60s ranches and split-levels, often over half an acre |
That last row is the part worth sitting with. East and South Monfort Heights carry their own pricing history because they used to be their own census areas. West Monfort Heights, the pocket with the oldest architectural mix and the fastest-moving listings at 21 days, doesn't get that same separate accounting. It gets folded into the neighborhood-wide $301,000 blend with no line item of its own.
So when a buyer sees "$301K" attached to Monfort Heights, that figure is genuinely useless as a preview of what a specific pocket will cost. It's a number built from two officially tracked sub-markets moving at different speeds, plus a third pocket the data doesn't isolate at all.
There's a second oddity in the numbers that points the same direction. East Monfort Heights and the neighborhood overall both landed at exactly $174 per square foot for the period ending June 2026, but East's year-over-year growth in that figure was 5.8% against the neighborhood's 12.6%. And East's sales volume nearly doubled, 22 homes in June 2026 versus 12 the year before, an 83% jump that outpaced the neighborhood's 31% overall increase. Demand is visibly concentrating in the newer, east-side stock right now, which is exactly the kind of shift a single blended median would hide from anyone who wasn't looking pocket by pocket.
There's a practical wrinkle here beyond pricing. South Monfort Heights is served by more than one school district depending on the exact parcel: most homes fall under Northwest Local School District, but stretches of the same pocket sit inside Oak Hills Local School District or the Cincinnati City School District boundary instead. Two houses on the same street can carry different district assignments. That's not a quality judgment on any of the districts involved. It's a zoning fact that affects levies, boundaries, and enrollment, and it's exactly the kind of detail that surfaces during a title search or a contract contingency rather than during the first showing. If you're comparing homes in South Monfort Heights specifically, confirm the district on the actual parcel with the Hamilton County Auditor before you assume a neighboring listing shares the same assignment.
The three pockets share amenities more than they share pricing. Mt. Airy Forest, roughly 1,500 acres and the city's largest park, borders the community's eastern edge and includes a wheelchair-accessible treehouse and a disc golf course. West Fork Park, closer to the west and south pockets, holds a German Pioneer Heritage Museum that opens on Sunday afternoons from May through October. Bicentennial Park adds pickleball courts and a playground.
Shopping and dining split roughly along the same east-west line. South Monfort Heights residents lean on the Kroger Marketplace off Harrison Avenue, Giovanni's Family Italian Restaurant nearby, and the Glenway Avenue corridor a few miles out, home to Ron's Roost and its monthly live music alongside Target and TJ Maxx. Closer to the eastern edge, North Bend Crossing pairs a Kroger with a Skyline Chili location, and nearby storefronts include Thai Namtip and Tavern on the Bend. Karen's Basket Factory and Country Store on Cheviot Road and the Monfort Aquarium and Pet Shop round out the more local retail. And for what it's worth, the first McDonald's in the Cincinnati area opened in Monfort Heights in 1959, the same location where the Filet-O-Fish was reportedly invented.
If you're using a portal median to decide whether Monfort Heights fits your budget, you're really asking three separate questions and getting one blended answer. The real decision isn't "can I afford Monfort Heights." It's closer to: do you want older character architecture on a larger, wooded lot with a slower but still competitive 31-day pace in the south, a faster-moving 21-day pocket of midcentury ranches to the west, or newer construction on a smaller footprint in the east, where both prices and sales volume are climbing faster than the rest of the neighborhood combined.
None of those are wrong answers. They're just different products wearing the same neighborhood name, and the number on the portal page won't tell you which one you're looking at until you ask which side of the interstate the listing sits on.
If you've already spent time browsing Monfort Heights and want the day-to-day texture of the place, from commutes to weekend routines, our guide to everyday life in Monfort Heights covers that ground.
Is Monfort Heights East or South a better investment right now? Both pockets are appreciating, but they're moving for different reasons. East is seeing faster sales volume growth on newer stock, while South is posting a larger year-over-year price gain on older, larger-lot homes. Which one fits depends on whether you're prioritizing newer construction or land and character.
Why can't I find separate pricing data for West Monfort Heights? Because it was never its own census-designated place the way East and South Monfort Heights were. It's a locally understood pocket, not an officially tracked market, so its pricing gets absorbed into the neighborhood-wide figure rather than reported on its own.
Does living in South Monfort Heights guarantee a specific school district? No. Most of South Monfort Heights falls under Northwest Local School District, but some addresses fall under Oak Hills Local or Cincinnati City School District instead. Confirm the assignment for the specific parcel rather than assuming it matches a neighboring street.
If you're trying to figure out which Monfort Heights pocket actually fits your budget and your priorities, that's the kind of comparison Michele Donovan walks through with buyers every week. Find Your Match — Start Here.

Whether you’re buying your first home, upgrading to fit a growing family, or downsizing for a new chapter, we’re here to guide you with the care and expertise you deserve.
MICHELE DONOVAN GROUP
6730 Ruwes Oak Dr Cincinnati, OH 45248